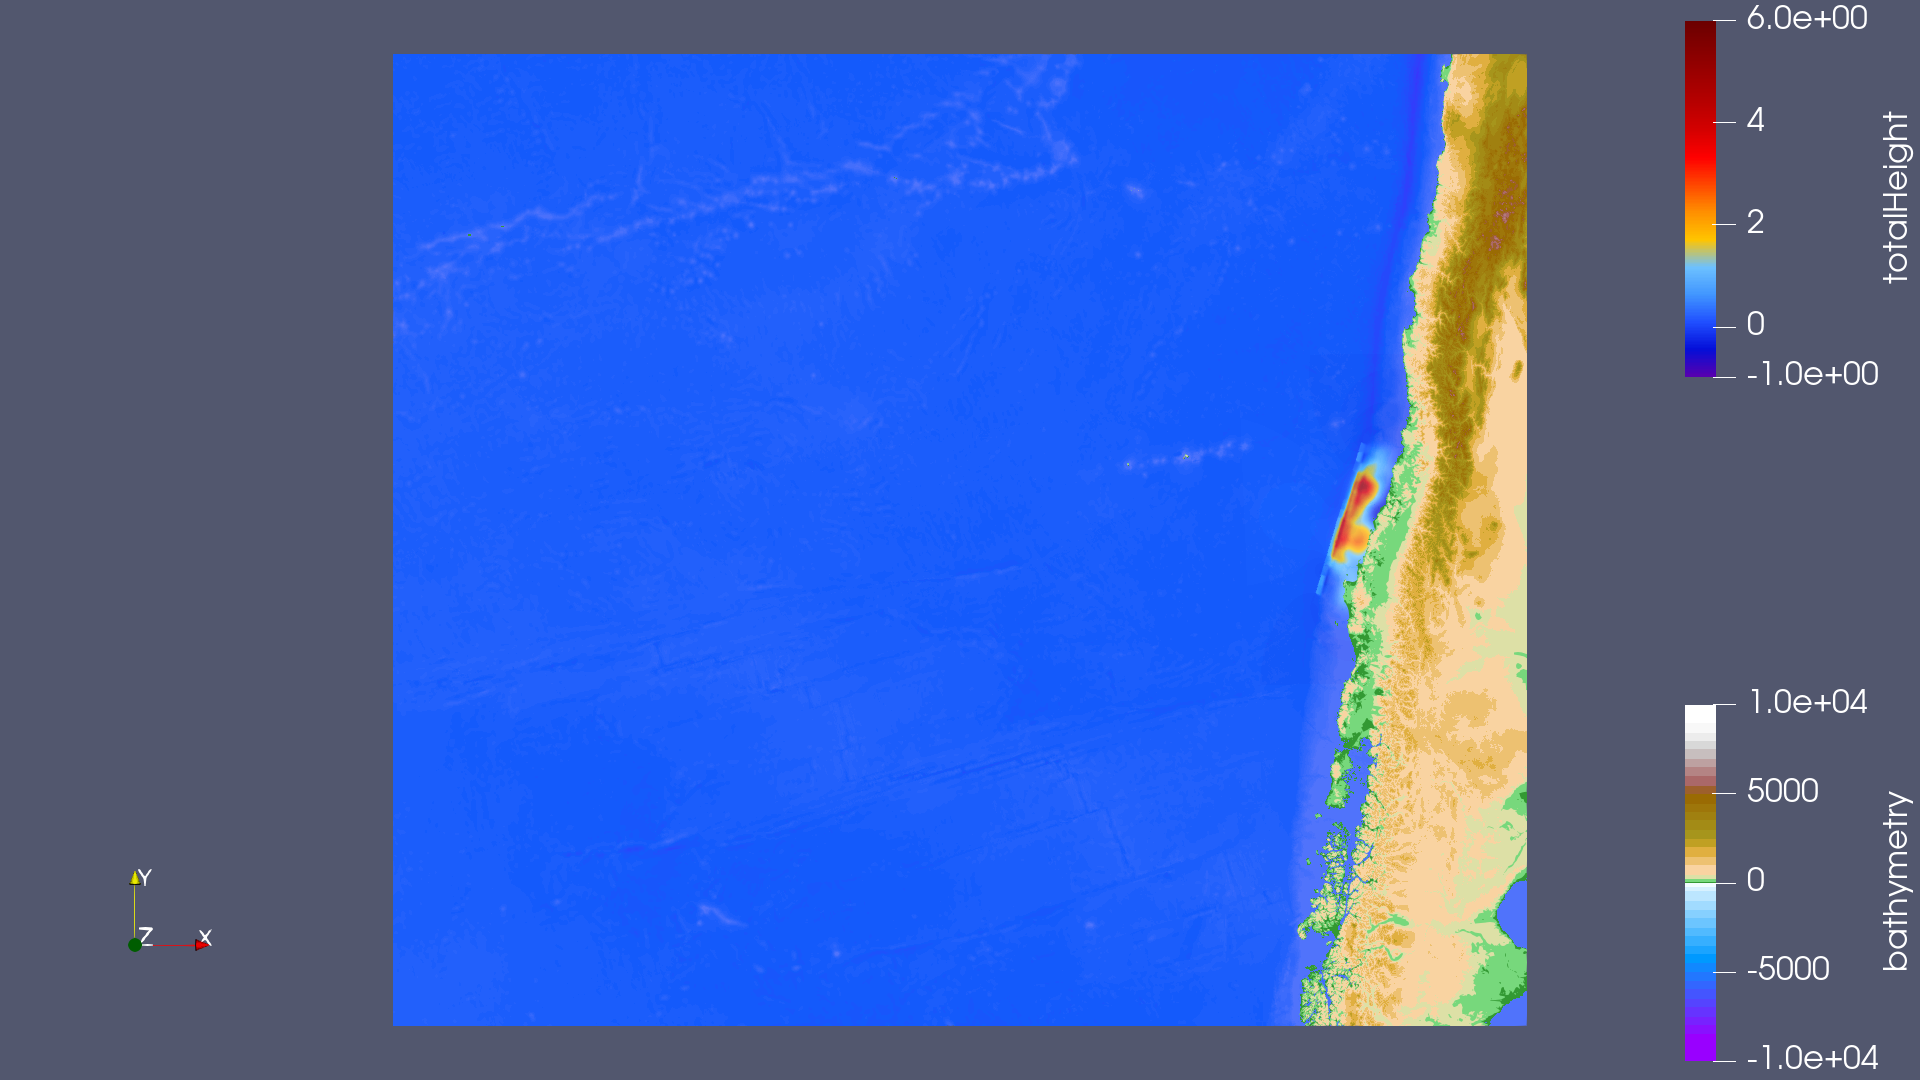
6. Tsunami Simulations
6.1. 2010 M 8.8 Chile Event
1. Visualization of the input data

2. Simulation of the tsunami event (Chile)
Scale in x-dimension predetermined with \(x: 3500000\)
Scale in y-dimension predetermined with \(y: 3000000\)
Since lambda is only the maximum value and this is not the corresponding value for the wave over the entire time course, we use the calculated value only as an order of magnitude and add a generous time span. The bottom line is that we use 15000 seconds.
Cell size: 1000m
Required cells in x-direction: \(\frac{3500000}{1000}=3500\)
Required cells in y-direction: \(\frac{3000000}{1000}=3000\)
Cell size: 500m
Required cells in x-direction: \(\frac{3500000}{500}=7000\)
Required cells in y-direction: \(\frac{3000000}{500}=6000\)
Cell size: 250m
Required cells in x-direction: \(\frac{3500000}{250}=14000\)
Required cells in y-direction: \(\frac{3000000}{250}=12000\)
6.2. 2011 M 9.1 Tohoku Event
1. Simulation of the tsunami event (Tohoku)
Scale in x-dimension predetermined with \(x: 2700000\)
Scale in y-dimension predetermined with \(y: 1500000\)
Since lambda is only the maximum value and this is not the corresponding value for the wave over the entire time course, we use the calculated value only as an order of magnitude and add a generous time span. The bottom line is that we use 13000 seconds.
Cell size: 2000m
Required cells in x-direction: \(\frac{2700000}{2000}=1350\)
Required cells in y-direction: \(\frac{2700000}{2000}=750\)
Cell size: 1000m
Required cells in x-direction: \(\frac{2700000}{1000}=2700\)
Required cells in y-direction: \(\frac{2700000}{1000}=1500\)
Cell size: 500m
Required cells in x-direction: \(\frac{2700000}{500}=5400\)
Required cells in y-direction: \(\frac{2700000}{500}=3000\)
2. Sõma
“On 11 March 2011, at 14:46 JST (05:46 UTC), an undersea megathrust earthquake of magnitude 9.0-9.1 occurred in the Pacific Ocean, 72 km east of the Oshika Peninsula in the Tōhoku region. It lasted about six minutes and generated a tsunami.”[1]
“Sõma is a town in Japan about 54.6 km north and 127.6 km west of the March 11, 2011, M 9.1 Tohoku event’s epicenter. We are interested in the time between the earthquake rupture and the arrival of the first tsunami waves in Sõma.”[2]
“On 13 March 2011, the Japan Meteorological Agency (JMA) published details of tsunami observations recorded around the coastline of Japan following the earthquake. These observations included […] that the water height in Sõma was \(7.3\,m\) or even higher at around 15:50 JST (06:50 UTC).”[2] 14:46 JST - 15:50 JST is a period of 01:04h or 64 minutes.
The rule of thumb \(\lambda \approx \sqrt{gh}\) with an epicenter height of \(h = 927.53\,m\) returns a lambda of \(\lambda \approx 95.663\,\frac{m}{s}\). The arrival time can be calculated \(\frac{\text{distance}}{\text{wave speed}} = \frac{138791\,m}{95.663\,\frac{m}{s}} \approx 1451\,s\).
Our epicenter is not the origin of our coordinate system. Therefore, we need to calculate the position of the station in relation to the lower left corner of the data input.
Our station with the coordinates (72043.83, 695481.28) w.r.t.
/// File: ../resources/config.json
{
  "output_frequency": 60,
  "stations": [
    {
      "name": "soma",
      "x": 72043.83,
      "y": 695481.28
    }
  ]
}
records that the tsunami wave arrived at the station off the coast of Sõma after 50 minutes (3000 seconds). This can also be clearly seen in the animation below. The station is marked with a pink dot. Since the 64 minutes date an approximate maximum of the water height, we can use our 50 minutes as the arrival time of the wave.
simulationTime |
totalHeight |
momentumX |
momentumY |
|---|---|---|---|
2042.8 |
-0.282932 |
-0.547347 |
-0.00366778 |
2101.51 |
-0.247034 |
-0.593376 |
-0.00786692 |
2160.21 |
-0.207596 |
-0.650629 |
-0.011954 |
2221.84 |
-0.161301 |
-0.726299 |
-0.0158865 |
2280.54 |
-0.111267 |
-0.816934 |
-0.0189854 |
2342.18 |
-0.0508251 |
-0.935998 |
-0.0212122 |
2400.88 |
0.0161152 |
-1.07648 |
-0.0219741 |
2462.52 |
0.0985336 |
-1.25697 |
-0.0209047 |
2521.22 |
0.190916 |
-1.46406 |
-0.017658 |
2582.86 |
0.30517 |
-1.7215 |
-0.0113819 |
2641.56 |
0.432955 |
-2.00599 |
-0.00217989 |
2700.26 |
0.581575 |
-2.32764 |
0.0106277 |
2761.89 |
0.762175 |
-2.70062 |
0.028352 |
2820.6 |
0.958899 |
-3.08081 |
0.0496001 |
2882.23 |
1.19188 |
-3.49183 |
0.0765755 |
2940.93 |
1.43802 |
-3.87582 |
0.106504 |
3002.57 |
1.71935 |
-4.246 |
0.141799 |
3061.27 |
2.00484 |
-4.53972 |
0.178126 |
3122.91 |
2.3166 |
-4.75527 |
0.217654 |
3181.61 |
2.61723 |
-4.84415 |
0.254904 |
3240.31 |
2.91262 |
-4.79635 |
0.289841 |
3301.95 |
3.20671 |
-4.58207 |
0.321873 |
3360.65 |
3.46133 |
-4.2152 |
0.345962 |
3422.28 |
3.69153 |
-3.66392 |
0.362758 |
3480.98 |
3.86675 |
-2.99602 |
0.369385 |
3542.62 |
3.99699 |
-2.1708 |
0.365737 |
3601.32 |
4.06479 |
-1.29791 |
0.351979 |
3660.02 |
4.07486 |
-0.373807 |
0.328553 |
3721.66 |
4.02248 |
0.614798 |
0.294375 |
3780.36 |
3.91392 |
1.54078 |
0.253819 |
3842 |
3.7415 |
2.46582 |
0.204207 |
3900.7 |
3.5261 |
3.27803 |
0.151764 |
3962.33 |
3.25212 |
4.03925 |
0.0928446 |
4021.03 |
2.95197 |
4.66439 |
0.034583 |
Contribution
All team members contributed equally to the tasks.